
Geeks Bot · Client Case Study
Intake24 Website
Website Design & Front-End Development for an Open-Source Research Platform
Intake24 is an open-source, self-completed dietary recall system used in studies from undergraduate projects to government national surveys. We designed and built its public website — turning a research method into a clear, credible, fast experience for researchers and participants alike.
- 0Routed pagesHome, features, science, resources…
- 0Vue componentsReusable, typed (TypeScript)
- 0Lighthouse performanceDesktop, production build
- 1.2sLargest Contentful PaintDesktop lab test
- 0%Lighter images2.34 MB → 0.78 MB
- 0%Smaller CSS352 KB → 41 KB over the wire
- 0msTotal Blocking TimeDesktop lab test
- 0Country databases6 live · 4 in development
The Challenge
Making a Research Method Feel Easy
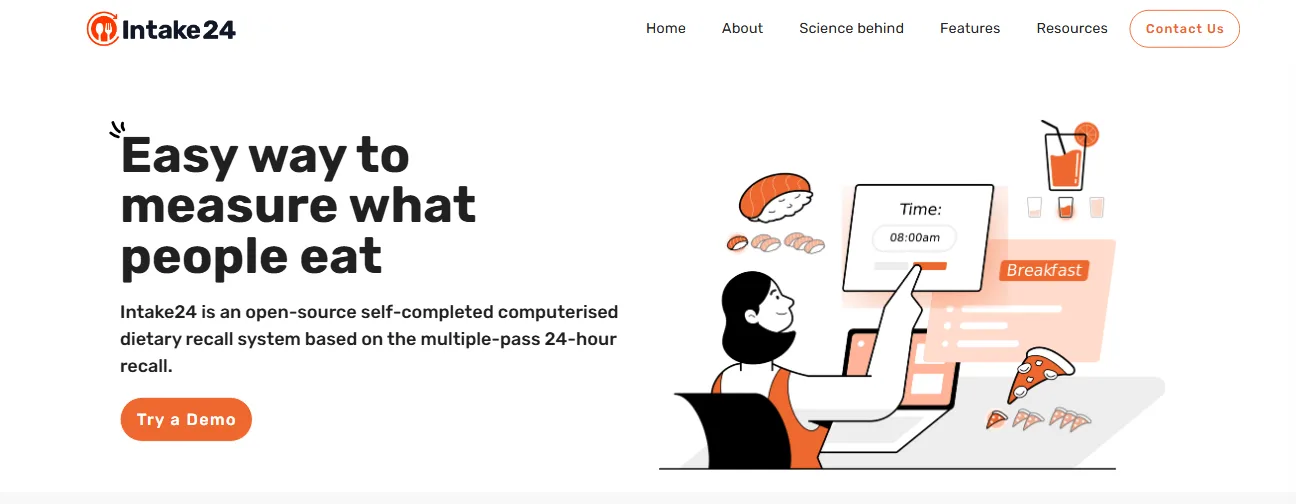
“Easy way to measure what people eat.”
That headline is where the site ended up — but the starting point was a tool explained mostly in academic language. Intake24 is accurate, free for research where feasible, and used internationally. The website's job was to make all of that obvious to someone who has never heard of a 24-hour recall.
Explain a Scientific Tool Simply
A multiple-pass 24-hour dietary recall is a research method. The site had to make it click for a first-time visitor in seconds.
Two Very Different Audiences
Researchers and survey teams evaluating the tool, and participants who just need to know it's quick and easy.
Prove Scientific Credibility
Validation studies, publications, national-survey usage and university partners had to be visible, not buried.
Show the Product Without a Login
Visitors needed to see what completing a recall actually looks like before trying the demo.
A Multi-Country Story
Localised food databases across the UK, New Zealand, Australia, Portugal, Denmark, the UAE and more.
Fast & Accessible Everywhere
Participants use phones, tablets and computers — the website had to match the product's accessibility promise.
Strategic Approach
Seven Layers, One Clear Story
Each layer answers a question a visitor has — from 'what is this?' to 'can I trust it?' to 'how do I start?'.
- 01
Information Architecture
9 routes grouped around three questions: what is it, does it work, how do I use it.
- 02
Visual System
Brand orange #EE672D, Rubik type, and a friendly illustration style that softens a scientific subject.
- 03
Component Library
31 Vue 3 + Vuetify components — cards, carousels, timelines, feature rows — reused across every page.
- 04
Product Storytelling
A 5-step walk-through built from real product UI, so visitors see the recall flow before they try it.
- 05
Credibility Layer
Impact logos, topics & populations, country databases, publications and the science behind the method.
- 06
Conversion Paths
'Try a Demo' and 'Contact Us' repeated at the natural decision points down every page.
- 07
Performance Pipeline
Vite build with image minification and gzip pre-compression baked in.
Homepage Design & Build
One Scroll From Curious to Convinced
The homepage moves through definition, benefits, a product walk-through, social proof and a call to action — in that order, on purpose.

- Hero that answers 'what is this?'One clear promise — "Easy way to measure what people eat" — plus a one-line definition and a demo button.
- Why use Intake24?Four alternating feature rows: accuracy, convenience, portion estimation, and the smart search under the hood.
- Here's how it worksFive numbered steps, each paired with a screenshot of the real survey interface.
- Impact & reachOrganisations, research topics, populations and country databases — credibility in one scroll.
Website Architecture
Nine Routes, Built Around Three Questions
What is Intake24? Does it work? How do I use it? Every page sits under one of those, so researchers can go deep while participants never get lost.
- Behind Intake24
- Publications
- Emailing Research
- Downloading Data
Built with Vue Router, using a shared default layout (app bar + footer) and a catch-all route back to the homepage.
Product Storytelling
Showing the Recall, Step by Step
Instead of describing the survey, the homepage shows it — five steps, each paired with real interface screens, alternating left and right as the visitor scrolls.
- 01Choose the time of the meal
- 02Add the foods & drinks consumed
- 03Estimate portions with photo prompts
- 04Answer custom questions
- 05Review & personalised feedback
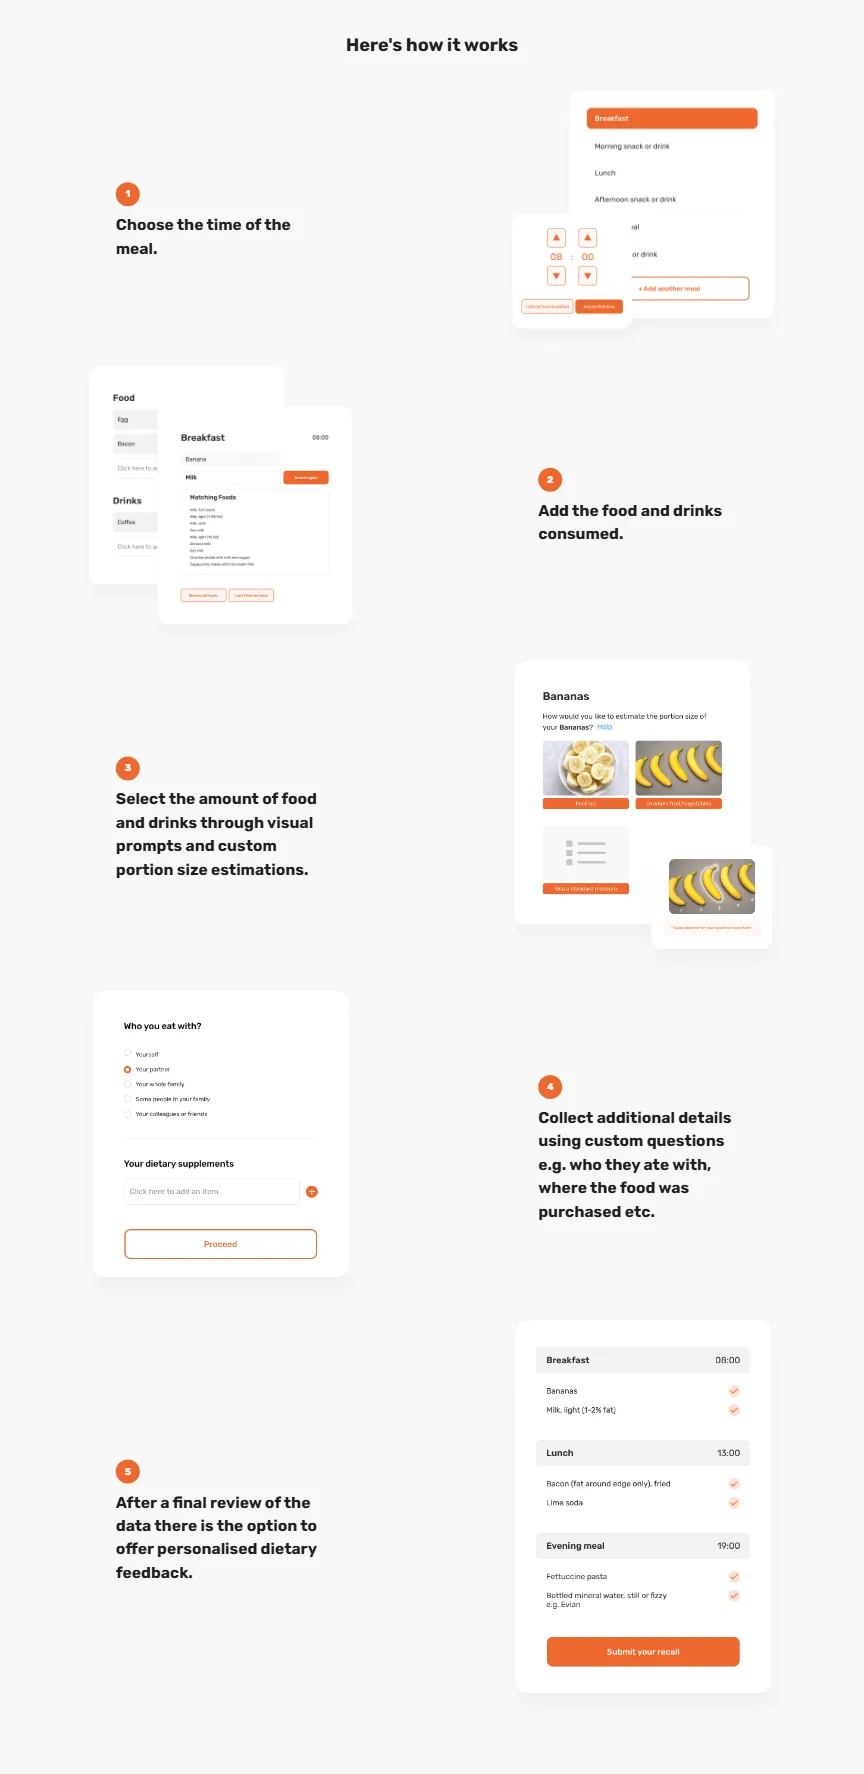
- Real UI, not stock mockupsMeal times, food search, photo-based portion sizes, custom questions and the final review — the actual survey screens.
- Zig-zag rhythmImage and text swap sides on every step, so a long section still reads quickly. On mobile it collapses to a single column.
- Data-driven sectionSteps live in one typed array — adding or reordering a step is a one-line change.
Feature Messaging
Why Use Intake24? — Four Reasons, Four Rows
Accuracy comparable to face-to-face interviews, 15–20 minutes to complete, validated food photographs, and smart search with AI-powered prompts — each with its own illustration.
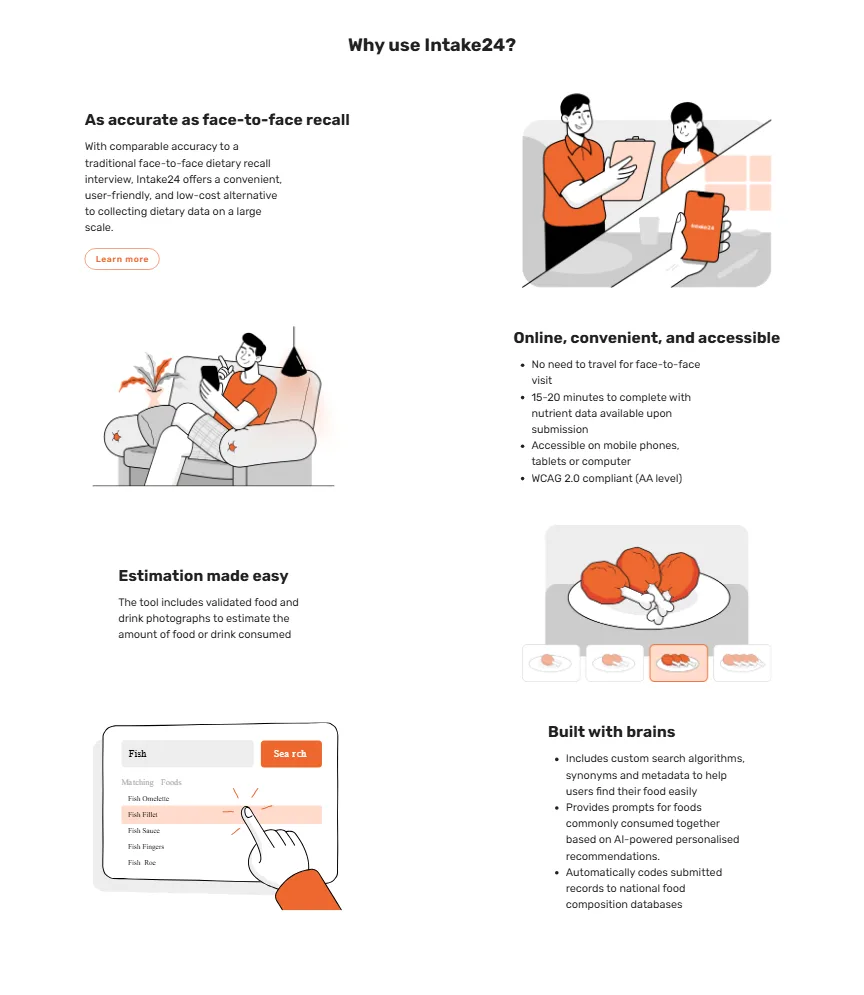
- As accurate as face-to-face recallThe scientific claim first — it's what researchers care about most.
- Online, convenient & accessibleNo travel, 15–20 minutes, any device, WCAG 2.0 AA compliant product.
- Estimation made easyValidated portion photographs instead of guesswork.
- Built with brainsSynonym search, AI-powered “commonly eaten together” prompts, automatic coding to national databases.
Inner Pages
Depth for Researchers, Without Clutter
Each inner page goes one level deeper for the people who need it. Pick a page to see it.
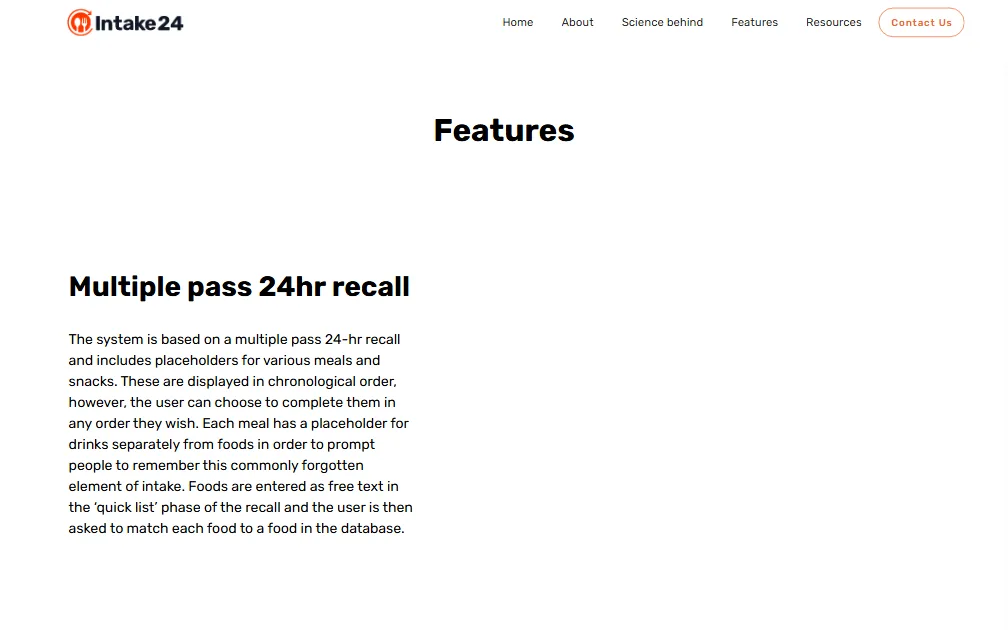
Features
A dedicated page for feature depth — nutrient output, localisation, open-source licensing — with downloadable sample CSV output for researchers.
Credibility & Reach
Proof, Presented Up Front
Intake24 is used from undergraduate studies to government national surveys. The impact section makes that reach scannable: organisations, topics, populations, countries.
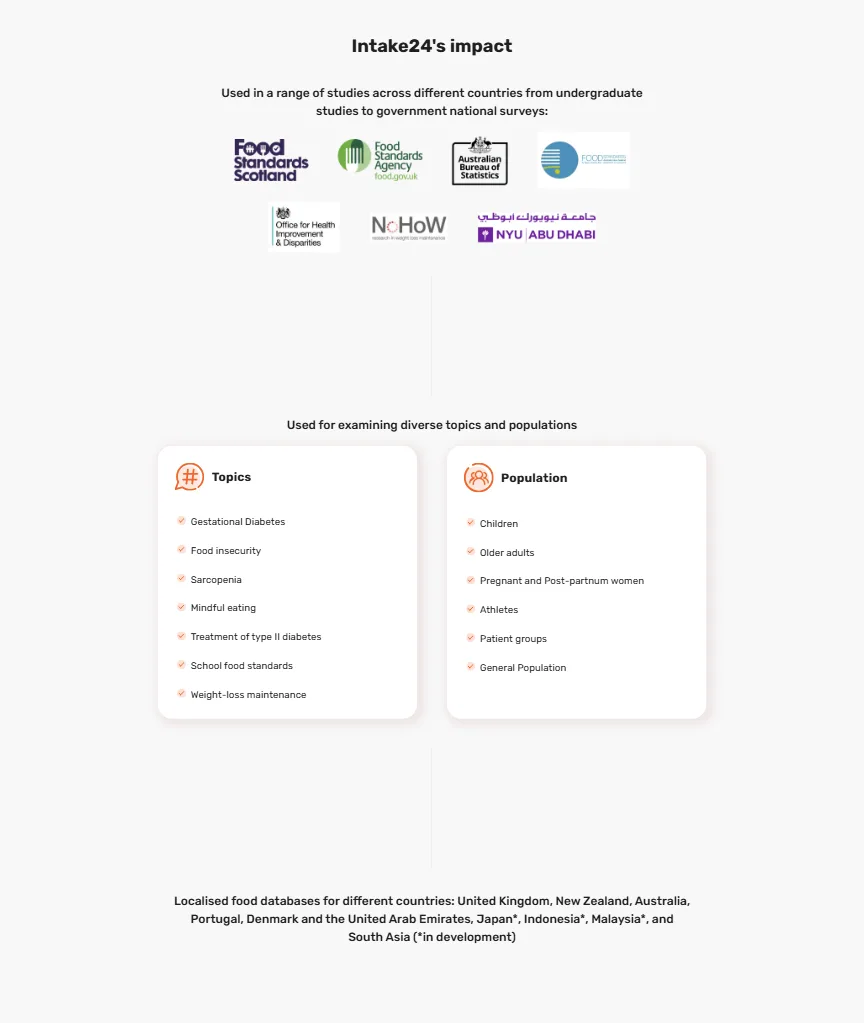
Research topics
- Gestational diabetes
- Food insecurity
- Sarcopenia
- Mindful eating
- Type II diabetes
- School food standards
- Weight-loss maintenance
Populations
- Children
- Older adults
- Pregnant & post-partum women
- Athletes
- Patient groups
- General population
Localised food databases
- United Kingdom
- New Zealand
- Australia
- Portugal
- Denmark
- UAE
- Japan*
- Indonesia*
- Malaysia*
- South Asia*
* in development at the time of the build.
Responsive Design
Built for the Phones Participants Actually Use
Recalls are often completed on a phone, so the website was designed to read just as well there — stacked layouts, a collapsing app bar, and full-width calls to action.
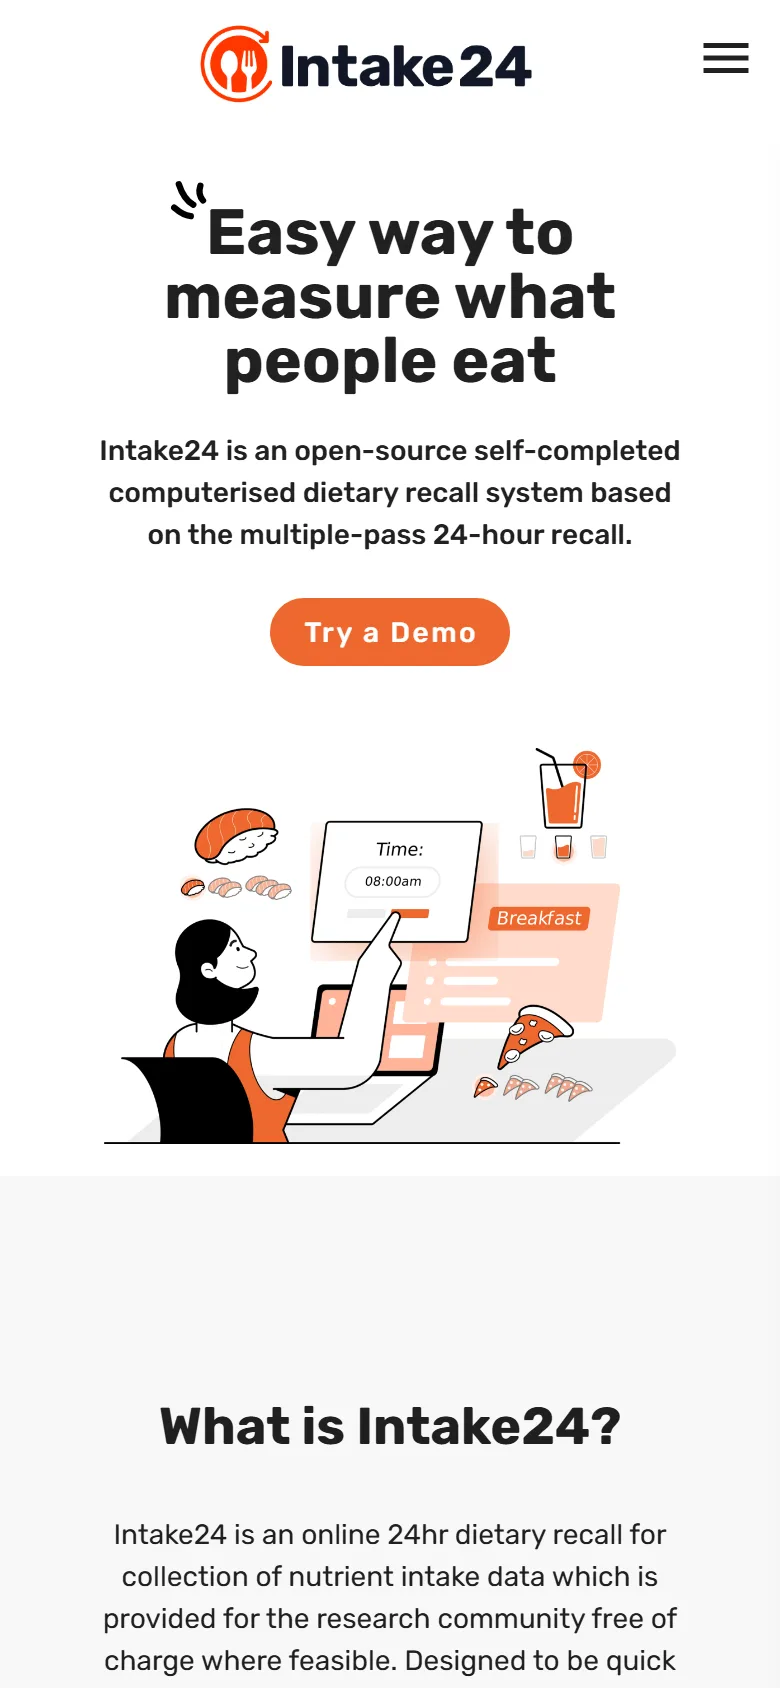

Same story, one column
The hero centres and stacks, the zig-zag walkthrough becomes a single readable column, and the About timeline swaps to a purpose-built small-screen component rather than squeezing the desktop version. Hover or tap the second phone to scroll the full page.
Results · Performance
Fast Where It Counts
Lighthouse 12 lab test of the production build (desktop preset), served with the build's own gzip files.
- 1.1sFirst Contentful Paint
- 1.2sLargest Contentful Paint
- 0msTotal Blocking Time
- 0.024Cumulative Layout Shift
Transparency note: on Lighthouse's throttled mobile profile the same build scores 60 for performance (LCP 4.2s). Prioritising the hero image, trimming the Vuetify bundle and replacing a third-party polyfill script are the clear next steps — reported here as-is.
Results · Payload
Shipping Less to Every Visitor
Image minification and gzip pre-compression were built into the Vite pipeline, so every deploy is optimised automatically — no manual export step to forget.
Measured from the project's source assets and its production build output. Bars share one scale per row group.
Key Achievements
Ten Milestones of the Build
- 019-page marketing website designed and built
- 0231 reusable Vue 3 + Vuetify components
- 035-step product walk-through from real UI
- 04Responsive timeline with separate desktop & mobile layouts
- 05Contact form with field checks & notifications
- 06Publications & science pages for researchers
- 0710 country food databases presented
- 08Image pipeline: 2.34 MB → 0.78 MB (−67%)
- 09Gzip pre-compression: JS −66%, CSS −88%
- 10Lighthouse desktop: 95 performance, 96 best practices
Tools & Technology
Tools & Technology
Front-end
- Vue 3
- Vuetify 3
- TypeScript
- Vue Router
- Pinia
- Sass
Build & quality
- Vite
- vite-plugin-imagemin
- vite-plugin-compression
- ESLint
- Prettier
- vue-tsc
Forms & data
- Axios
- vue3-notification
Design
- Rubik
- Material Design Icons
- Custom illustration set
Evidence & Measurement
What We Can Measure
Like all our case studies, this one separates what we measured from what we can't show.
Verified & measured
- Page & component count (from the codebase)
- Lighthouse lab scores of the production build
- Image savings — 34 assets, source vs. built
- Bundle sizes — raw vs. gzip
- Responsive layouts (screenshots in this page)
- Content: topics, populations, country databases
Not claimed here
- Visitor or traffic growth
- Demo sign-ups or enquiries
- New research partnerships
- Search ranking changes
- Field (real-user) Core Web Vitals
Screenshots on this page are captures of the delivered build. Scientific claims about Intake24 (accuracy, usage, localisation) are the platform's own, as published on the site.
Final Impact
From Research Method to a Website People Understand
What the project delivered:
- A clear, friendly front door to a scientific tool
- Credibility made visible: studies, partners, publications
- The product shown, not just described
- A reusable Vue component system for future pages
- A build pipeline that ships 67% lighter imagery
- Desktop performance in the 90s
Got a Complex Product That Needs a Simple Story?
We design and build websites that make hard things easy to understand.